Part of my build server management responsibilities include trying to figure out why things are going wrong. I don’t know about other environments, but our builds run a lot of processes. For example, we use Robocopy to individually deploy a website’s sub-directories. When things go wrong, it’s hard to debug because these robocopy processes start and stop so quickly, I don’t have time to double-click them in Process Explorer. I usually resorted to adding lines in our deployment script to output the Robocopy command line and exit code, then running the build, waiting for it to finish, then inspecting the build logs.
Ugh.
Last week, I discovered that Process Monitor captures process start and exit events. Just the information I need in these situations.
Open Process Monitor, and click the “Filter” button.

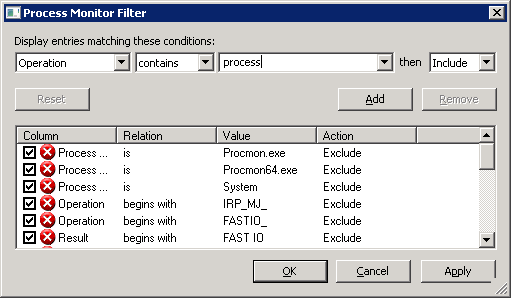
Create a new condition that matches when the Operation column contains the word process (don’t forget to click the Add button).

Click OK and Process Monitor will start to show process start and exit events. Start events will show the parent process ID and command line used to start the program. Exit events will show the exit/return code and CPU/memory statistics.

If you double-click the start event, you’ll be able to see the entire command line and all the process’s environment variables.
Thanks to the Windows Sysinternals team for the great tools.